Beginning with business inventories data, the narrative unfolds by revealing how this key metric shapes the strategies and successes of modern businesses. From bustling warehouses to executive boardrooms, the story of business inventories data is one of constant motion, decision-making, and adaptation, setting the stage for how companies thrive in ever-changing markets.
Business inventories data refers to the comprehensive information businesses track regarding their raw materials, work-in-progress items, and finished goods. This data plays a crucial role in supply chain management, helping organizations balance demand, optimize storage, and respond quickly to changing consumer needs. By monitoring inventory levels, businesses and analysts gain valuable insights into economic trends, production efficiency, and overall market health.
Definition and Importance of Business Inventories Data
Business inventories data refers to the quantitative records of goods and materials that businesses hold at any given point in time. It is a key economic metric that tracks the value and volume of items waiting to be sold or used in production by companies across industries. Understanding business inventories is crucial not only for operational decision-making but also for interpreting economic health on a national scale.
Business inventories data typically includes finished goods, work-in-progress items, and raw materials. These components give a full picture of resources available for sale, further processing, or production. The data is essential for supply chain managers because it reflects the balance between supply and demand, helping prevent stockouts or overstock situations.
Monitoring inventory levels allows businesses and analysts to:
- Identify trends in consumer demand and adjust production schedules accordingly.
- Spot inefficiencies or bottlenecks in the supply chain.
- Inform restocking and procurement decisions to optimize cash flow.
- Gauge economic conditions, as significant changes in inventories can indicate shifts in business confidence or market activity.
Main Components of Business Inventories Data
The main components of business inventories are:
- Raw Materials: Basic inputs purchased for use in the production process.
- Work-in-Progress (WIP): Goods that are in the midst of being manufactured but are not yet complete.
- Finished Goods: Completed products ready for sale to customers or distributors.
The Role of Inventories in Supply Chain Management
Inventories play a pivotal role in maintaining smooth supply chain operations. Adequate inventory ensures that companies can meet customer demand without delays, while holding too much increases storage costs and ties up working capital. Strategic inventory management helps buffer against supply disruptions, supports lean manufacturing practices, and enables businesses to respond flexibly to market changes.
Types of Business Inventories
Every business manages different kinds of inventories depending on its industry, operational model, and customer demands. Recognizing each inventory type helps stakeholders understand unique management priorities and risks.
Major Inventory Types
The three fundamental types of inventories are:
- Raw Materials: Unprocessed materials used to manufacture products.
- Work-in-Progress (WIP): Items that have entered the production process but are not yet finished.
- Finished Goods: Products that have completed the manufacturing process and are ready for sale or shipment.
Industry Examples and Typical Inventory Profiles
Below is an overview of how different industries manage their inventory types:
| Industry | Inventory Type | Description | Typical Volume |
|---|---|---|---|
| Automotive | Raw Materials | Steel, plastics, glass for car manufacturing | High |
| Automotive | Work-in-Progress | Assemblies, partially assembled vehicles | Medium |
| Retail | Finished Goods | Ready-to-sell apparel, electronics | High |
| Pharmaceutical | Raw Materials | Chemical compounds for drug manufacturing | Medium |
| Pharmaceutical | Finished Goods | Packaged medications, vaccines | Low to Medium |
| Food & Beverage | Raw Materials | Agricultural produce, grains | High (but perishable) |
| Food & Beverage | Work-in-Progress | Partially processed food items | Low to Medium |
Management Challenges for Each Inventory Type
Each inventory category presents unique challenges for businesses. Raw materials can be affected by supplier reliability and price volatility. Work-in-progress inventories require careful scheduling to avoid production bottlenecks. Finished goods inventories must be managed to prevent obsolescence or spoilage, especially in industries with rapid turnover or perishable items.
Sources and Frequency of Business Inventories Data
Reliable business inventories data can be obtained from a variety of sources with different degrees of detail and timeliness. Accurate and up-to-date data is essential for effective operations and informed economic analysis.
Primary Data Sources
The main sources for business inventories data include:
- Government Agencies: National statistical offices (such as the U.S. Census Bureau), which release monthly business inventories reports.
- Industry Associations: Organizations compiling inventory data for specific sectors (e.g., National Retail Federation, Automotive Industry Associations).
- Company Financial Reports: Publicly traded companies disclose inventory figures in quarterly and annual filings.
- Market Research Firms: Private entities aggregating commercial data for broader market insights.
Reporting Frequency and Level of Detail
The timeliness and granularity of inventory data vary by source and industry. Government agencies typically publish monthly summaries, while some sectors update data weekly or quarterly depending on market volatility and reporting regulations.
| Source | Data Frequency | Level of Detail |
|---|---|---|
| National Statistical Offices | Monthly | Aggregate by sector and region |
| Industry Associations | Monthly or Quarterly | Sector-specific, sometimes company-level |
| Company Filings | Quarterly/Annually | Company and segment-level |
| Market Research Firms | Weekly/Monthly | Custom, often detailed but may be sampled |
Methods for Measuring and Recording Inventories
Accurate measurement of inventories ensures reliable financial reporting and effective resource planning. Various accounting methods and technologies help track inventory movement and value.
Common Inventory Accounting Methods
The three most widely used inventory valuation methods are:
- FIFO (First-In, First-Out): Assumes that the earliest goods purchased or produced are the first to be sold, leading to inventory values that reflect recent purchase costs.
- LIFO (Last-In, First-Out): Assumes that the most recently acquired goods are sold first, often resulting in lower taxable income when inventory costs rise.
- Weighted Average: Calculates inventory value based on the average cost of all goods available for sale during the period.
Physical Inventory Count Process

To maintain accuracy, businesses regularly conduct physical counts of their inventory. The basic steps are:
- Plan the count schedule and assign counting teams.
- Organize inventory storage areas and label items for identification.
- Count each item and record quantities on count sheets or digital devices.
- Reconcile counted quantities with recorded balances and investigate discrepancies.
- Adjust inventory records to reflect actual counts.
Use of Automated Systems and Technology
Modern inventory management increasingly relies on technology to enhance accuracy and efficiency. Barcode scanners, RFID tags, and cloud-based inventory management software enable real-time tracking and seamless integration with order management systems. Automation reduces human error and provides better visibility into stock levels across multiple locations.
Impact of Inventory Data on Economic Indicators
Business inventories data is a critical component in economic analysis, offering valuable insights into the pace of economic activity and business sentiment. Changes in inventory levels can directly impact key macroeconomic indicators.
Influence on GDP Calculations
Inventory levels are factored into Gross Domestic Product (GDP) calculations as part of the investment component. An increase in inventories is considered an addition to GDP, while a decrease is treated as a reduction. This is because unsold goods represent production that has occurred but has not yet been consumed.
Relationship Between Inventories and Business Cycles
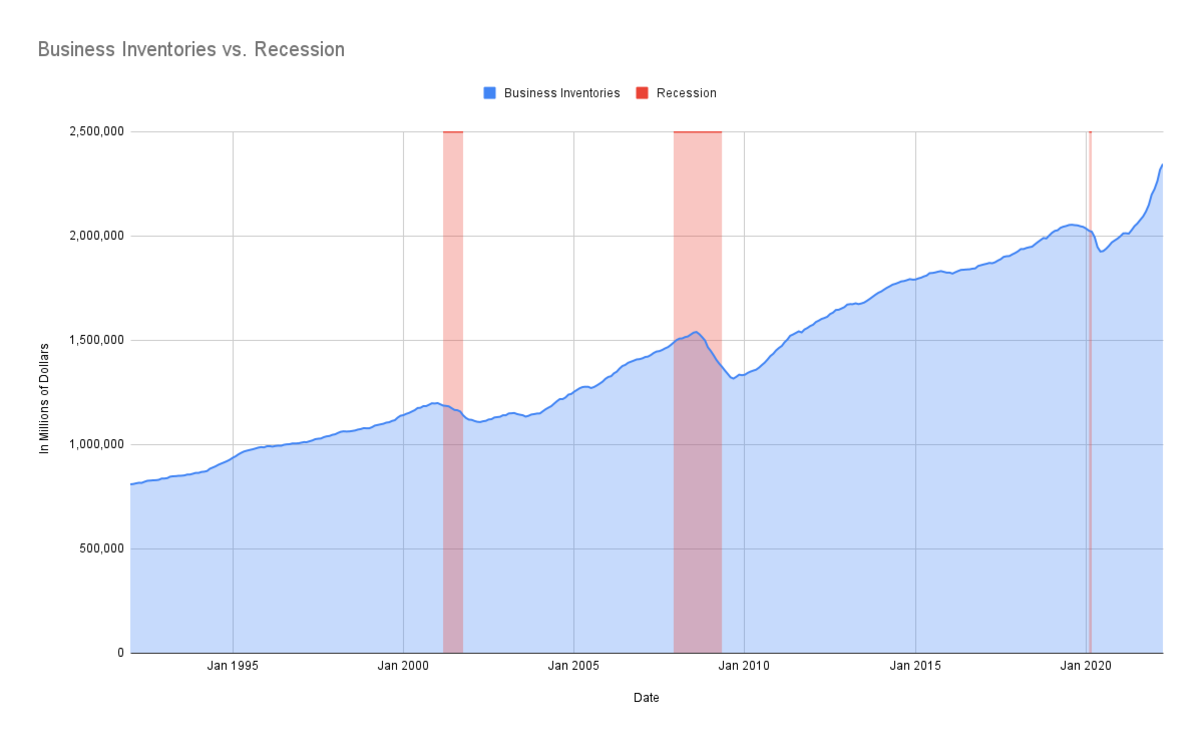
When inventories rise sharply, it may signal slowing demand or overproduction, indicating the onset of an economic slowdown. Conversely, rapidly falling inventories can suggest strong sales and possibly even supply shortages, often seen during economic recoveries.
Signals for Broader Economic Trends
Fluctuations in business inventories often precede shifts in the broader economy. Rising inventories may prompt companies to scale back production, affecting employment and supplier orders. Conversely, declining inventories can trigger increased production and investment, spurring economic growth. Analysts closely monitor inventory trends to forecast turning points in the business cycle.
Applications of Business Inventories Data in Business Decision Making
Informed use of business inventories data enables companies to make smarter decisions in daily operations and strategic planning. Accurate inventory insights help organizations remain agile and competitive.
Sales Forecasting and Demand Planning
Businesses analyze inventory data alongside sales patterns to anticipate future demand. Historical inventory turnover rates and current stock levels inform production schedules and purchasing strategies, helping avoid both overstocks and stockouts.
Optimizing Storage and Reducing Costs
Efficient inventory management allows companies to optimize warehouse usage and reduce holding costs. Inventory data highlights slow-moving or excess stock, enabling timely markdowns, promotions, or supplier renegotiations to improve profitability.
Enhancing Customer Satisfaction

Maintaining optimal inventory levels ensures that products are available when customers want them. Effective inventory tracking minimizes delays, reduces order cancellations, and fosters customer trust—key ingredients for long-term loyalty.
Challenges and Pitfalls in Interpreting Inventories Data
Despite its value, business inventories data is not without limitations. Misinterpretation or errors can lead to flawed decision-making and inaccurate economic conclusions.
Common Errors in Recording or Reporting Inventory Levels
Errors in inventory data often stem from inadequate counting procedures, data entry mistakes, or failure to account for damaged, obsolete, or lost items. Such inaccuracies can distort financial statements and mislead stakeholders.
Limitations of Inventory Data as a Standalone Metric, Business inventories data
While inventory figures reveal much about supply chain efficiency and business health, they do not capture demand-side factors or future sales prospects. Context from other indicators—such as sales, orders, and economic outlook—is necessary for comprehensive analysis.
Factors That Can Distort Inventory Figures
Numerous variables can impact the accuracy and interpretation of inventory data:
- Product returns
- Spoilage or obsolescence
- Seasonal fluctuations in demand
- Bulk purchasing or stockpiling
- Data reporting lag
- Inventory transfers between locations
Visualization and Presentation of Business Inventories Data
Presenting inventory data in a clear, accessible format is essential for analysis and decision-making at all organizational levels. Effective visualization can reveal trends, inefficiencies, and opportunities.
Best Practices for Visualizing Inventory Trends

Visualizations such as line charts, bar graphs, and heat maps help stakeholders quickly identify patterns in inventory levels over time. Using consistent time intervals and units, providing context with historical comparisons, and highlighting anomalies can make reports more actionable.
Quarterly Inventory Data Table Template
A well-designed table facilitates comparison of inventory metrics across different business units and time periods:
| Business Unit | Q1 Inventory | Q2 Inventory | Q3 Inventory | Q4 Inventory |
|---|---|---|---|---|
| Manufacturing | 120,000 | 112,500 | 130,000 | 125,000 |
| Distribution | 85,000 | 90,000 | 88,000 | 92,500 |
| Retail | 60,000 | 70,000 | 75,000 | 68,000 |
Summarizing Complex Inventory Data for Executive Reports
For senior management, focus on high-level trends, key performance indicators (KPIs), and actionable insights. Use concise charts, highlight year-over-year changes, and provide brief executive summaries to facilitate quick understanding and decision-making.
Future Trends in Business Inventories Data Management
As technology evolves and supply chains grow more complex, new approaches are emerging to manage business inventories more effectively. These innovations promise greater accuracy, speed, and strategic value from inventory data.
Emerging Technologies Advancing Inventory Tracking
Cutting-edge technologies such as artificial intelligence (AI), Internet of Things (IoT) sensors, and blockchain are transforming inventory management. For example, AI-powered demand forecasting improves replenishment accuracy, while IoT devices enable real-time monitoring of stock levels and environmental conditions in warehouses.
Changes Driven by E-Commerce and Global Supply Chains
The rise of e-commerce has accelerated the need for agile, responsive inventory systems capable of handling rapid shifts in demand and supply across international borders. Cloud-based platforms and integrated logistics solutions offer end-to-end visibility, enabling companies to synchronize inventories worldwide.
Integration of Real-Time Data Analytics
Imagine a multinational retailer using real-time analytics dashboards that aggregate inventory data from hundreds of locations. Advanced algorithms instantly detect anomalies—such as sudden stockouts or unusual surpluses—and trigger automated alerts. Operations teams can then react immediately, adjusting shipments and promotions to optimize inventory across all channels. In practice, industry leaders like Amazon and Zara already leverage such technologies, resulting in faster response times, reduced waste, and improved customer satisfaction.
Wrap-Up
In summary, understanding business inventories data is essential for navigating today’s dynamic business environment. Whether analyzing economic indicators or streamlining internal processes, leveraging accurate inventory data can drive smarter strategies and sustainable growth. As new technologies evolve and global commerce accelerates, those who master inventory management will be best positioned for future success.
FAQ Overview
What is business inventories data used for?
It is used to manage supply chains, monitor economic conditions, forecast sales, and optimize storage costs.
How often is business inventories data updated?
The frequency varies by industry and reporting standards, but it can be updated monthly, quarterly, or in real time with automated systems.
Which industries rely most on inventory data?
Manufacturing, retail, e-commerce, and logistics companies heavily depend on accurate inventory data.
Why can inventory data sometimes be inaccurate?
Errors can occur due to miscounts, system glitches, product returns, spoilage, or delayed data entry.
How does inventory data impact customer satisfaction?
Accurate inventory data ensures products are available when needed, reducing delays and improving customer experiences.